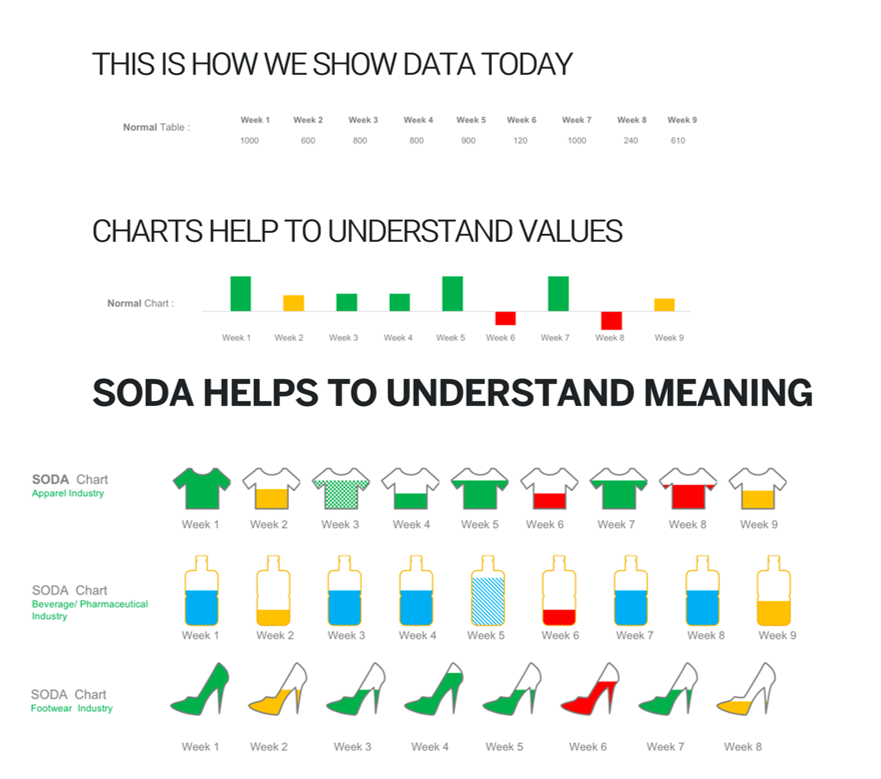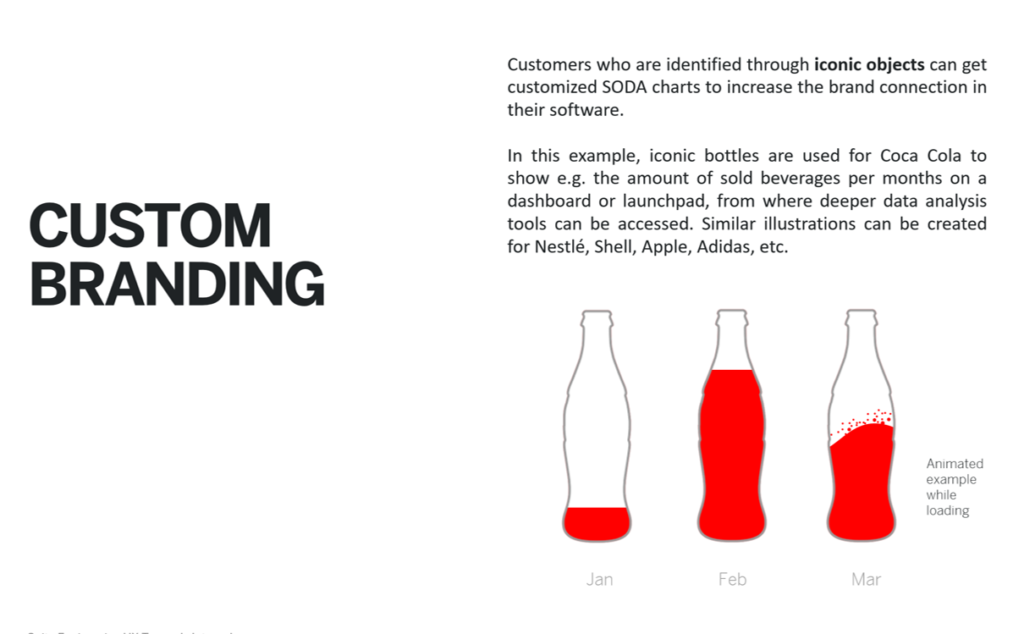
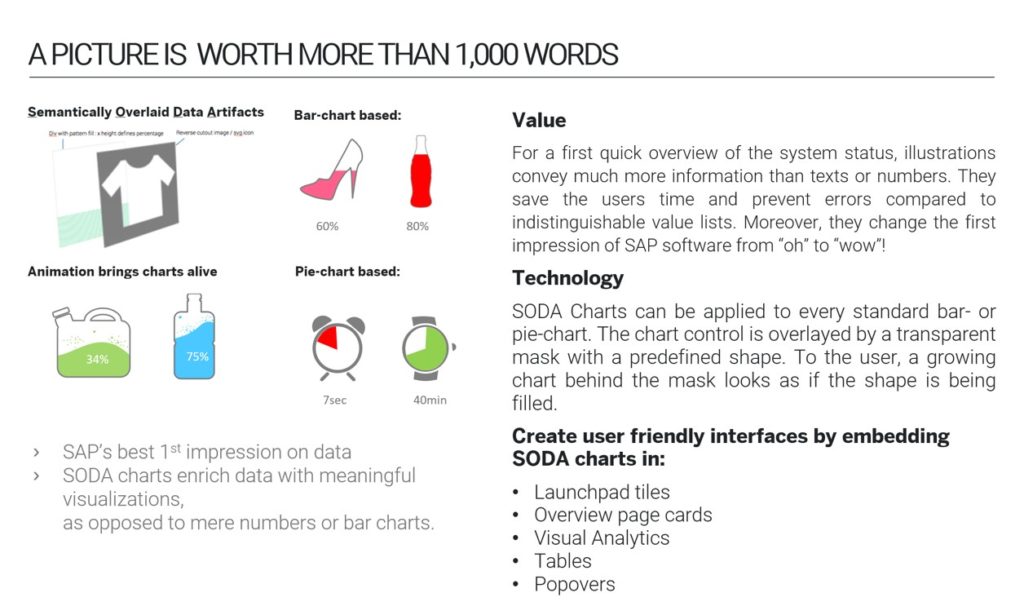
While working on creating a new Fashion Vertical / Product within SAP with customers like Adidas / Armani etc I was foxed and perplexed by how much dependency we in SAP had with tables and the proliferation of tables everywhere. I came up with this concept of SODA charts/ Status Indicators which would have a global bank of icons visualized within vertical bar charts. The icons would be divided into different verticals and made into a reusable control with animations and semantic colors.
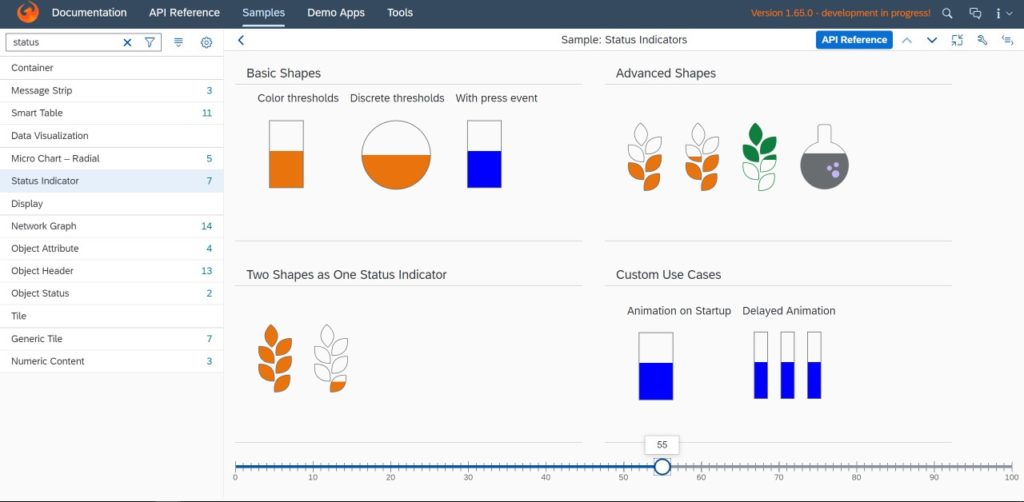
This was globally recognized and finally made and shipped as a reusable control with a huge bank of icons which could be embedded within SAP apps everywhere and has high usage in IoT apps and Industry verticals. (Control shown in the SAP global UI library below)
“design can be art.
Design can be aesthetics.
design is so simple.
that’s why it’s so complex”